Quenchometer -Cooling Curve Method
Product Details:
- Number of Specimens 1
- Frequency 50 Hz
- Interface Type RS232
- Accuracy 1C
- Humidity 20% - 90% RH
- Temperature Room temperature to 400C
- Power Supply 230 V AC, 50 Hz
- Click to View more
Quenchometer -Cooling Curve Method Price And Quantity
- 1 Piece
- 350000.0 INR/Piece
- Programmable digital timer with alarm
- High quality stainless steel immersion heater
- Powder coated mild steel body
- Integrated thermal printer
- USB, RS485
- Overheat protection, emergency stop switch
- Max 1.0 kW
- Oil, water, polymer solutions
- Magnetic stirrer for uniform quenching
Quenchometer -Cooling Curve Method Product Specifications
- Up to 200 mm
- 12 mm diameter x 60 mm length
- 0.1C
- Standard
- 0.2 - 0.8 MPa
- Heat treatment cooling analysis
- 230 V AC, 50 Hz
- Room temperature to 400C
- 0-150 mm
- 1C
- 50 Hz
- RS232
- 40 kg
- 20% - 90% RH
- 1
- Digital
- Semi-automatic
- Data Logging, Real-time Graph Plotting
- Metallurgical laboratory, Hardening & tempering process control
- Digital LCD
- Benchtop
- 0 - 300C
- 230 V AC
- Quenchometer Cooling Curve Apparatus
- 400 mm
- <1 sec
- 0 to 300 seconds
- Single sample
- Adjustable
- Programmable digital timer with alarm
- High quality stainless steel immersion heater
- Powder coated mild steel body
- Integrated thermal printer
- USB, RS485
- Overheat protection, emergency stop switch
- Max 1.0 kW
- Oil, water, polymer solutions
- Magnetic stirrer for uniform quenching
Quenchometer -Cooling Curve Method Trade Information
- kolkata
- 1 Piece Per Month
- 1 Months
- Asia
- All India
Product Description
Quenchometer Cooling Curve Method Cooling characteristics of quenchant cooling curve analysis ASTM D 648206Tensi Agitator Method
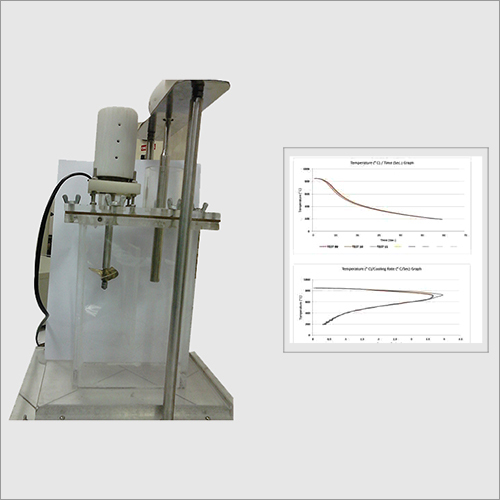
The Quenchometer is a PC based completely automatic testing apparatus to determine the cooling characteristics of aqueous polymer quenchant as per ASTM D 648206The apparatus is operated from a host PC running our windows based dedicated software and is capable of monitoring displaying the cooling curve in REAL TIME apart from a host of other features as describe below Building blocks
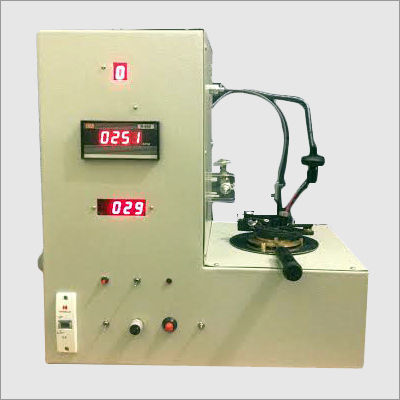
Muffle Furnace A vertical furnace with digital read out with a central hole for the thermocouple capable of holding a temperature of 850oC 2oC for at least 1 minute
Thermocouple and handle A special K Type thermocouple probe as per ASTM standard having dimensions Diameter125mm after grind finish with a central hole of 15mm and a length of 66mm
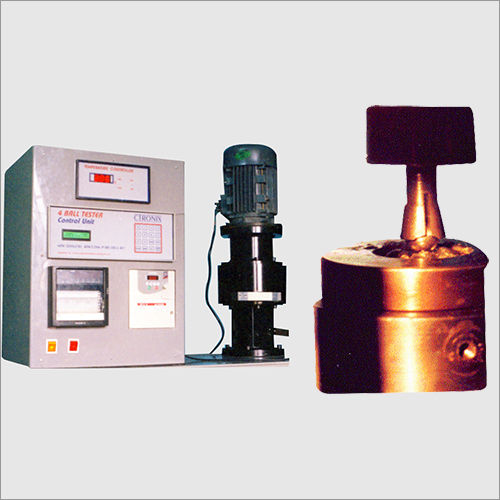
Tensi Agitator Bath Cooling Curve Analysis Tensi Agitator The Quenchant is stored in a special container as per ASTM guidelines with a partition The Quenchant is agitated by a propeller driven by a variable speed DC Motor the RPM is controlled to have specified flow rate of agitation
Operating Procedure
The thermocouple is heated in the bath and needs to be quickly dipped into the bath
As soon as the probe is dipped into the Quenchant the data acquisition system starts data acquisition and dumps the data into a matrix on the hard disc recording temperature 10C and time in 1second and displays in Real Time
i Temperature vs time
ii Temperature vs cooling rate
After the temperature reaches 200o100o C or as preset by the operator the data acquisition stops The temperature can be set to any other value as desired by the operator
The operator may stop the data acquisition after the elapsed time of 60 seconds The computer stops and end of experiment is displayed
Details of the graphs plotted
Two graphs are plotted on the screen which can be printed on demand
i Temp vs Time graph Y axis temperature falling in 10 C and X axis is time in 1second To arrive at any temperature place the mouse cursor at any point of the curve displays the temperature and time values at that point The following information will also be displayed
Time to cool to 600o C 400o C and 200o C
ii Temp vs cooling rate graph This graph plots the cooling rate vs temperature and has the same feature like above to read the data at any point with a cursor move The following data will be calculated and displayed over and above this graph
Maximum cooling rate o C Sec
Temperature where the max cooling rate occurs
Cooling rate at 300o C
Cooling characteristics of quenchant Cooling Curve Analysis ASTM D 62001
The system and the Operating Procedure is similar to the previous system as far as thermocouple probe and muffle furnace is concerned The only change is the sample bath as mentioned below
Quenchant sample containerCooling Curve Analysis The Quenchant sample container is as per ASTM D62001 Section 75 is made of heat proof damage proof tall form vessel ID 115 5mm capable of holding 2000 50 ml of liquid with adequate free space
Precision-Controlled Quenching Process
Utilizing a high-quality stainless steel immersion heater and a magnetic stirrer, the Quenchometer delivers uniform cooling curves for in-depth analysis. Its digital LCD display, real-time graph plotting, and integrated thermal printer enable seamless monitoring and documentation, providing researchers with reliable data during every test cycle.
Advanced Compatibility and Safety Features
Compatible with various cooling mediaincluding oils, water, and polymer solutionsthis apparatus offers high versatility in metallurgical applications. Built-in safety features such as overheat protection and an emergency stop switch cater to user safety, while robust construction ensures longevity in rigorous laboratory environments.
FAQs of Quenchometer -Cooling Curve Method:
Q: How does the Quenchometer - Cooling Curve Method operate in a metallurgical laboratory?
A: The Quenchometer utilizes a digital control mode to precisely monitor and regulate the cooling process. It employs a stainless steel immersion heater and a magnetic stirrer to ensure uniform heating and quenching of samples (single, 12 mm 60 mm). The process is programmable, enabling accurate control over timing and temperature, supported by real-time data output and automated safety protocols.Q: What types of cooling media can be used with this apparatus?
A: This apparatus is compatible with oil, water, and polymer solutions, supporting flexibility for various heat treatment and metallurgical analysis requirements. Users can select the most appropriate cooling medium based on their specific process or sample characteristics.Q: When should I use the integrated printer and what data does it record?
A: The integrated thermal printer is ideal for immediate documentation of test results. It provides printed records of temperature curves, elapsed times, and process details, supporting traceability and data integrityespecially crucial for laboratory reporting or quality assurance.Q: Where is this equipment best installed and used?
A: Designed as a benchtop device, the Quenchometer is ideal for installation in metallurgical laboratories, research centres, or quality control departments seeking heat treatment analysis and process optimization. Its robust yet compact construction suits standard laboratory settings with 230 V AC power supply.Q: What is the process for running a quenching test with this device?
A: Users first mount the single specimen (12 mm diameter 60 mm length) and select their cooling medium. After programming the digital timer and setting required temperatures (up to 400C), the test is started. The magnetic stirrer ensures uniform heat distribution, while digital controls capture real-time cooling curves. Post-test, results are viewable on the LCD or printable for records.Q: Is the Quenchometer safe and energy efficient for prolonged use?
A: Yes, the apparatus features overheat protection, an emergency stop switch, and sturdy, powder-coated mild steel construction. Its maximum power consumption is just 1.0 kW, making it suitable for regular laboratory use, while safety and longevity remain uncompromised.Q: What are the key benefits of using this cooling curve apparatus?
A: The apparatus provides high measurement accuracy (1C) with rapid response time (<1 second), supporting reliable and repeatable results. Its versatile interface (USB, RS232, and RS485), real-time data logging, and programmable features streamline process control, enhancing efficiency and reproducibility for metallurgical heat treatment evaluations.
Price:
- 50
- 100
- 200
- 250
- 500
- 1000+

Other Products in 'Petroleum Testing Instruments' category
- Mr Prabir Kumar Sircar (Proprietor)
- Mobile : 07313726688
- Mr. Shome Shankar Sircar
- Mobile : 07313726688
-
 Send Inquiry
- BNo 37A ,CHAKRABERE LANE,Kolkata - 700003, West Bengal, India
- Phone : 07313726688
AN ISO 9001:2008 COMPANY

Developed and Managed by Infocom Network Private Limited.